Big MacD

This indicator uses the power of MACD to highlight on chart the first "light pink" and "light green" bar when MACD is rolling over from bearish to bullish or bullish to bearish, respectively. This gives you a jump on reversals. 

Big macd

What is Big MacD?

The MACD (Moving Average Convergence Divergence) is a trend-following momentum indicator that calculates the difference between a fast and a slow exponential moving average (EMA) to identify changes in market direction. It includes a histogram that visualizes the difference between the MACD line and its signal line, highlighting the strength and direction of momentum. Positive histogram bars show upward momentum, while negative bars indicate downward momentum, with changes in size signaling potential trend shifts.

Big MacD enhances MACD by pinpointing the first light pink bar (negative histogram increasing) and first light green bar (positive histogram decreasing), which often signal early signs of trend reversals. These specific bars help traders identify the first weakening of bearish or bullish momentum, making it easier to catch potential reversal points and optimize entry or exit timing.

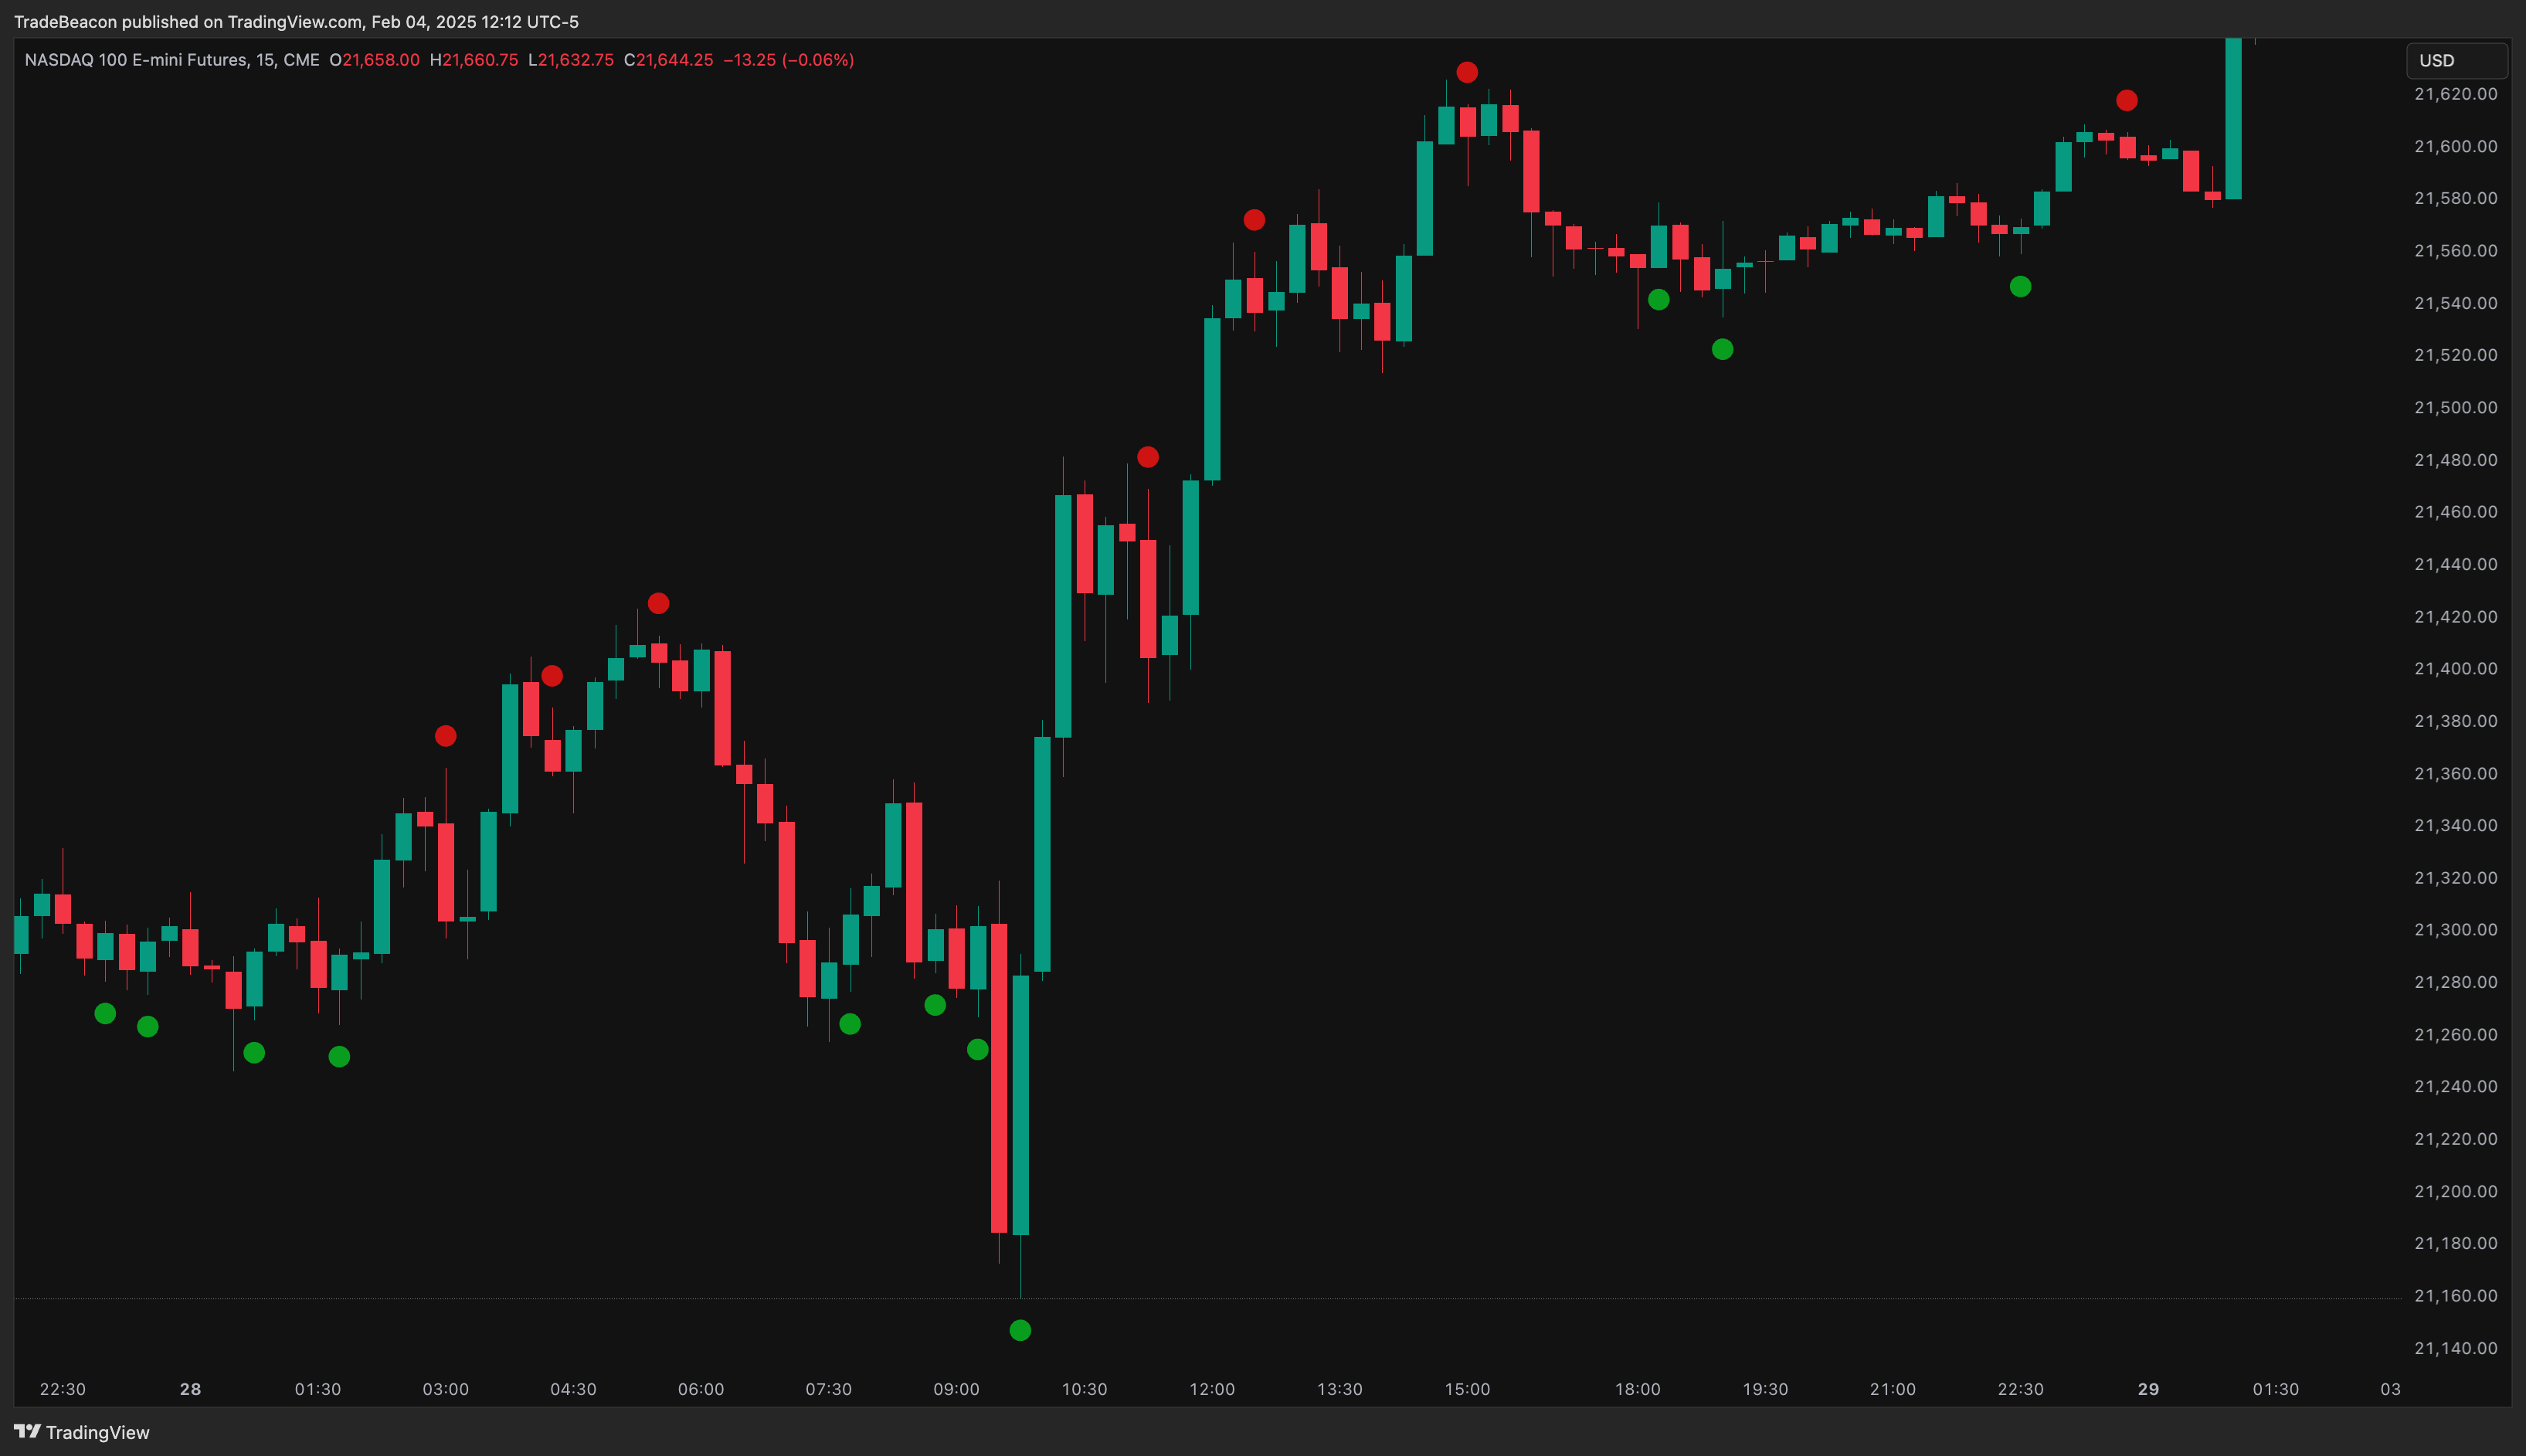
Reversals can be seen by looking for the red and green dots

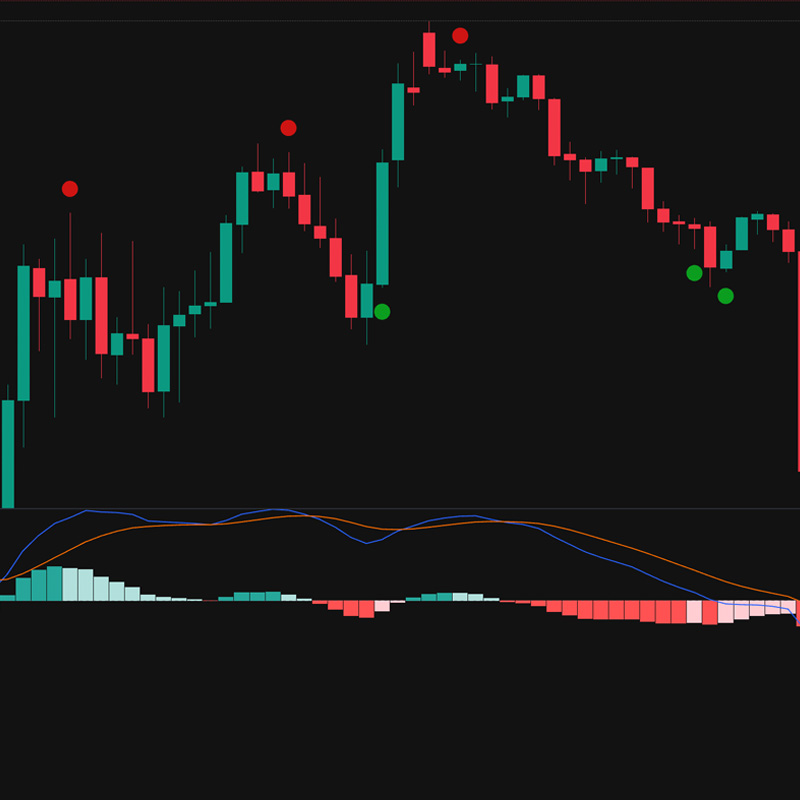
Big MacD uses the power of MACD to show you the direct light green bar (bearish) and the first light pink bar (bullish) that would normally be hidden at the bottom of your screen if you use MACD as an indicator.

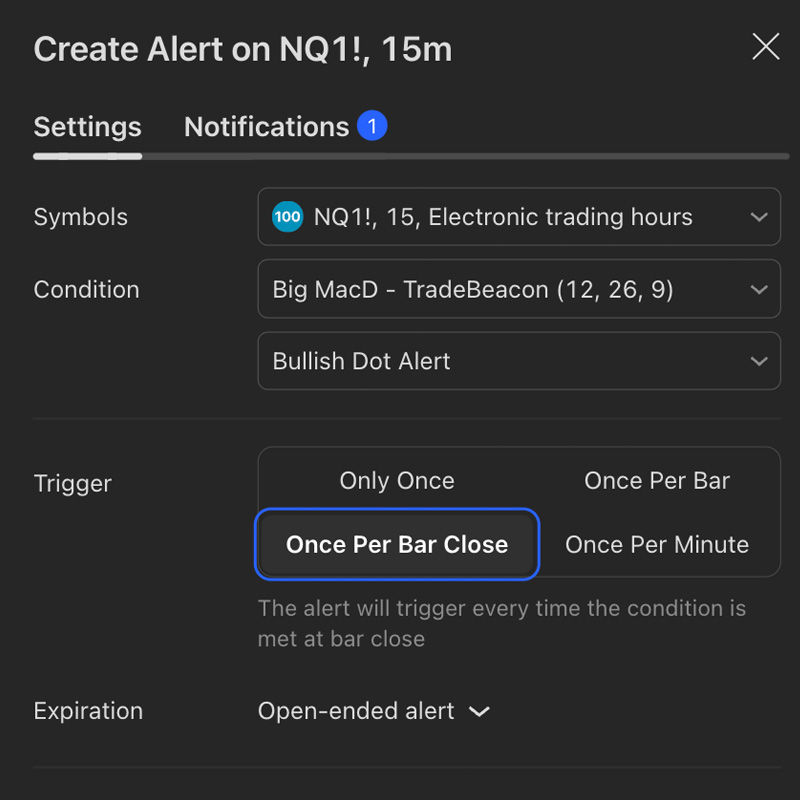
Long and Short entries can be added as Tradingview alerts

The best part about all of our indicators is that you can put them on any chart and any ticker and create custom alerts for them. Want to be notified when Bitcoin has a 1 hour green dot? You can do that. You want to see the NQ 10 min red dots? That too!

Want to take the next step in your trading journey?

TradeBeacon has been created to make your life easier, your trades better, and for you to not have to be staring at screens all day. Come see what hundreds of traders swear by.