
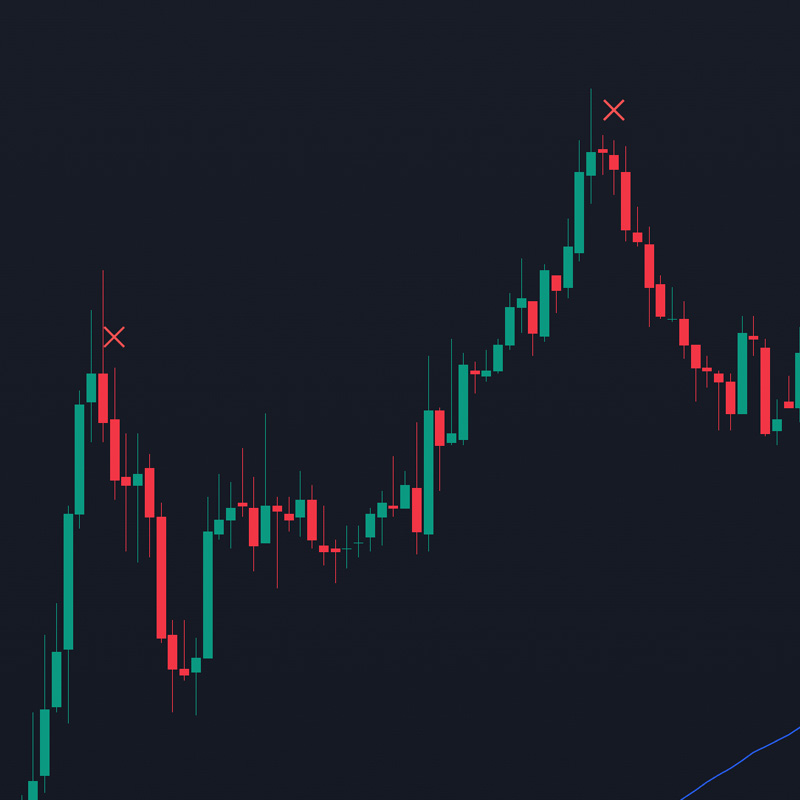
Reversals are shown as an X above/below the candles
Pretty self explanatory. X Indicator is best combined with supply and demand zones, high/low of day. It isn't great on extreme trend days so when using it, it's best not to jump at the first X you see.
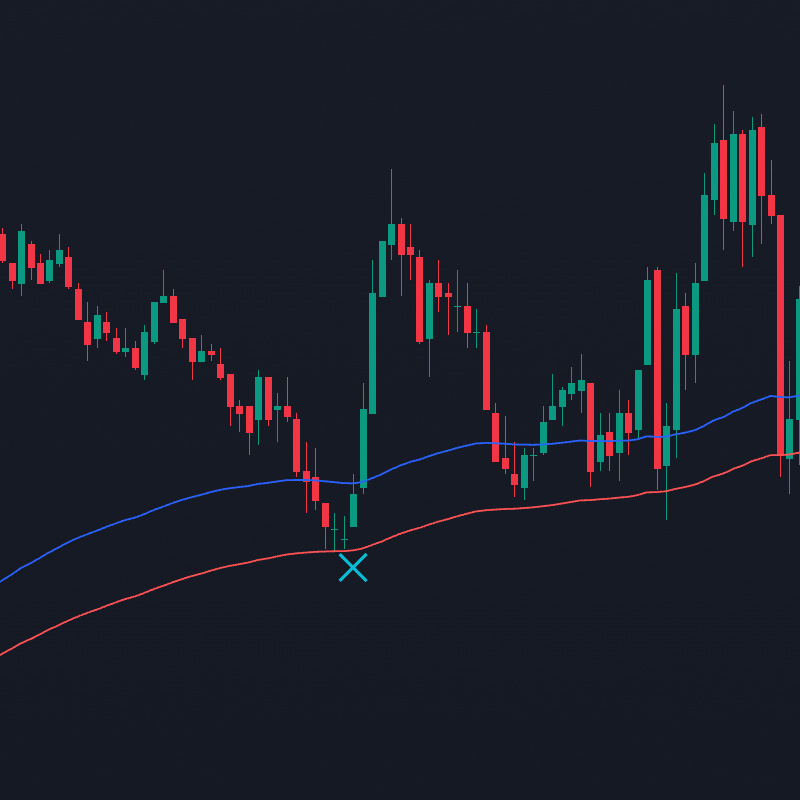
The hourly 9 and 13 EMA are shown on chart to aid in entries
The X's that print under/above the candles can be used in conjunction with the hourly EMAs for even stronger entries.
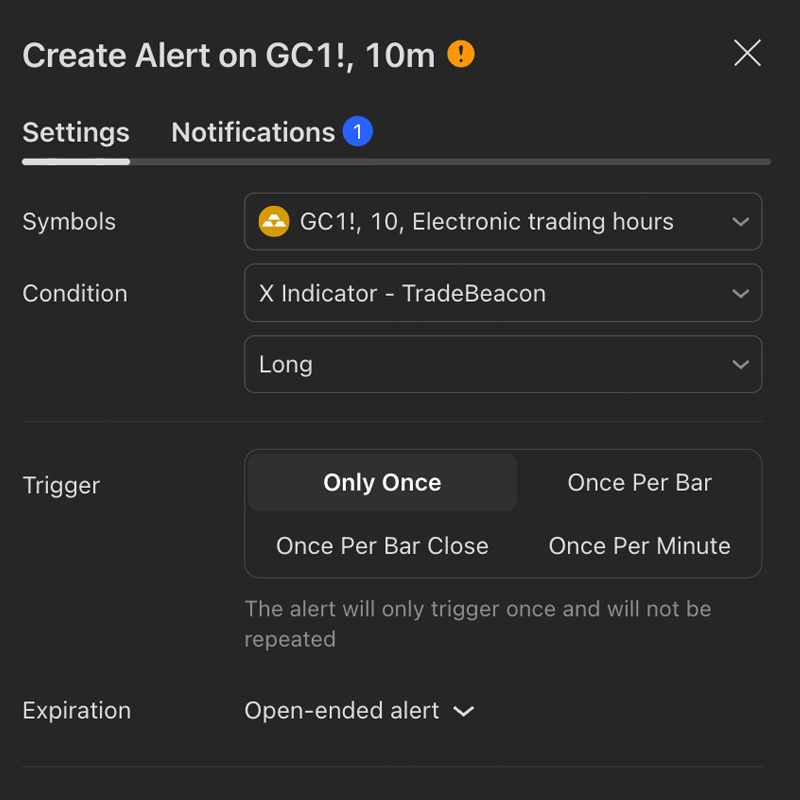
Add the X Indicator to your own charts for any timeframe and any ticker + create your OWN alerts.
The best part about X Indicator is that through Tradingview you can put our indicators on your OWN charts. Any ticker, any timeframe. Creating your own alerts is incredibly easy.