Docs Navigation
Trendbot
Video Walkthrough
What is Trendbot?
Trendbot is essentially a multi-timeframe trend analysis dashboard that combines several powerful indicators into one cohesive system. Think of it as your trading command center that tells you:
- The trend direction on 5 different timeframes at once
- Precise entry and re-entry signals
- When price is hitting extreme levels using ATR extensions
- Institutional sentiment through the TICK indicator
- And it does all of this while filtering signals through RSI and TSI oscillators
The beauty is that instead of having to flip between multiple charts and timeframes, everything is right there on your screen in real-time.
The Multi-Timeframe Dashboard
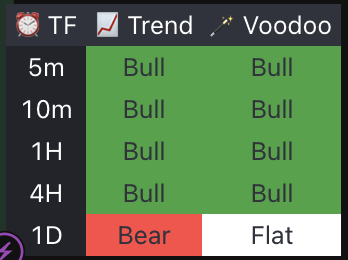
Let's start with the heart of this indicator - the multi-timeframe dashboard. You'll see this table that shows you trend analysis across five key timeframes:
- 5 minute for scalping
- 10 minute for short-term swings
- 1 hour for intraday direction
- 4 hour for swing trading
- Daily for overall market bias
For each timeframe, you get two critical pieces of information:
- Trend Direction: This uses a simple but effective EMA crossover system. When the red line is above the green, we've entered an uptrend and the background will change to green. When the red is below the green, the background changes to red (a downtrend)
- Voodoo Signal: This is where it gets interesting. The 'Voodoo' column combines TSI (True Strength Index) and RSI indicators to filter out weak signals. It only shows 'Bull' when the TSI and RSI are showing strength. Same logic applies for 'Bear' signals.
This gives you an instant snapshot of whether the timeframes are aligned or if there's divergence between short and long-term trends.
EMA Crossover System
Now let's talk about the core trend detection mechanism. Trendbot uses the a classic EMA crossover system, but with some smart enhancements.
You'll see two lines plotted on your chart:
- Red line: (faster moving average)
- Green line: (slower moving average)
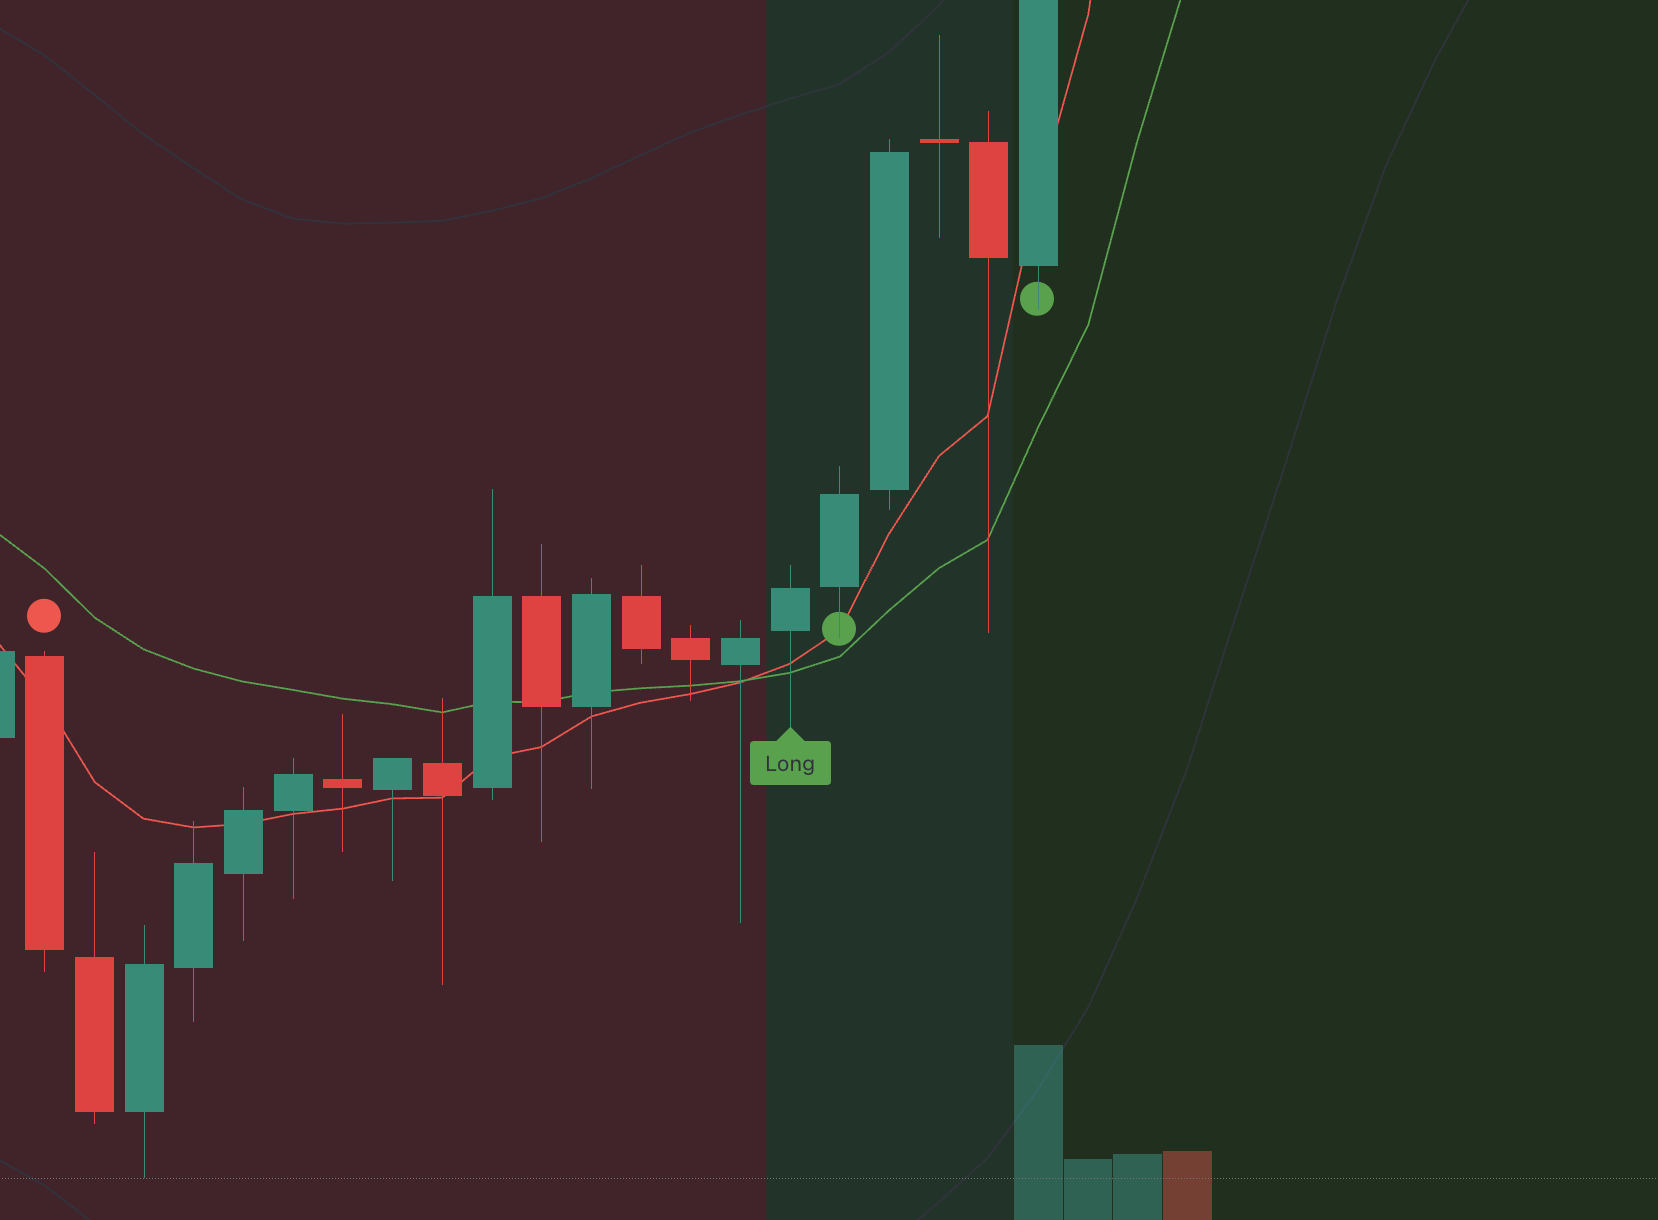
When the red line crosses above the green line, we enter 'Bull Mode' and your chart background turns light green. When the red crosses below the green, we enter 'Bear Mode' and the background turns light red.
But here's where it gets sophisticated - the indicator doesn't just give you signals on every crossover. It waits for what I call 'confirmation retests' before generating entry signals.
Entry Signal Logic

The entry signal logic is brilliant because it helps you avoid false breakouts and whipsaws. Here's exactly how it works:
For Long Signals: After the red line crosses over the green line (entering Bull Mode), the indicator waits for price to:
- Pull back and touch or slightly penetrate the the red line
- Stay above or at the green line
- Close back above the red line with a green candle
When all these conditions are met, you get a 'Long' label on your chart.

For Short Signals: After the red line crosses below the green line (entering Bear Mode), it waits for:
- Price to bounce up and touch the red line
- Stay below or at the green line
- Close back below the red line with a red candle
Then you get a 'Short' label.
This retest mechanism is crucial because it confirms that the trend has real momentum and isn't just a fake-out.
Re-Entry System

One of our favorite features is the re-entry system. After you get that initial Long or Short signal, the indicator continues to monitor for additional entry opportunities.
You'll see green dots below price during Bull Mode when price retests the 9 EMA and bounces - these are additional long opportunities. Similarly, you'll see red dots above price during Bear Mode for additional short entries.
This is incredibly valuable because trends often give you multiple entry points, and this system helps you scale into positions or catch the trend if you missed the initial signal.
TSI and RSI Filtering
Now let's talk about the 'Voodoo' signals in the dashboard. This combines two oscillators to filter out weak signals:
True Strength Index (TSI): This is a momentum oscillator that uses double-smoothed price changes. It's less noisy than regular RSI and better at identifying genuine momentum shifts.
RSI Filter: It uses a fast RSI set with a filter level
A 'Bull' Voodoo signal only appears when:
- TSI line is above its signal line (momentum is positive)
- AND RSI is significant (price momentum is bullish)
For 'Bear' signals, it's the opposite - TSI below signal line AND significant in a bearish way.
This dual-filter system helps eliminate signals that occur during choppy, sideways markets.
Understanding ATR Extensions with TICK

ATR extensions are one of Trendbot's most powerful features, but first let me explain what ATR actually is:
What is ATR?: ATR stands for Average True Range - it measures how much a stock typically moves from high to low each day. Think of it like this: if a stock has an ATR of $2, that means on average it swings $2 from its daily high to low. It's basically a volatility meter that adapts to current market conditions.
Why ATR Matters: When price moves 3 times the normal ATR distance, it's hitting a statistical extreme - like a rubber band stretched too far. These are natural reversal or pause points.
TICK Integration: Here's where Trendbot gets really smart - it combines these ATR extremes with TICK data. TICK measures how many NYSE stocks are being bought vs sold in real-time. It shows you what institutions are actually doing with their money.

How It Works Together:
- Trendbot creates dynamic bands at ATR above and below current price
- When TICK is positive (institutions buying), the lower band shows thick green (institutional support)
- When TICK is negative (institutions selling), the upper band shows thick red (institutional resistance)
- 'ATR' labels appear when price hits these statistical extremes
Trading Applications:
- Use ATR bands as profit targets - price often reverses at these levels
- Strong TICK flow + ATR extreme = very high probability zone
- Avoid fighting institutional TICK direction at ATR levels
Setting Up Alerts
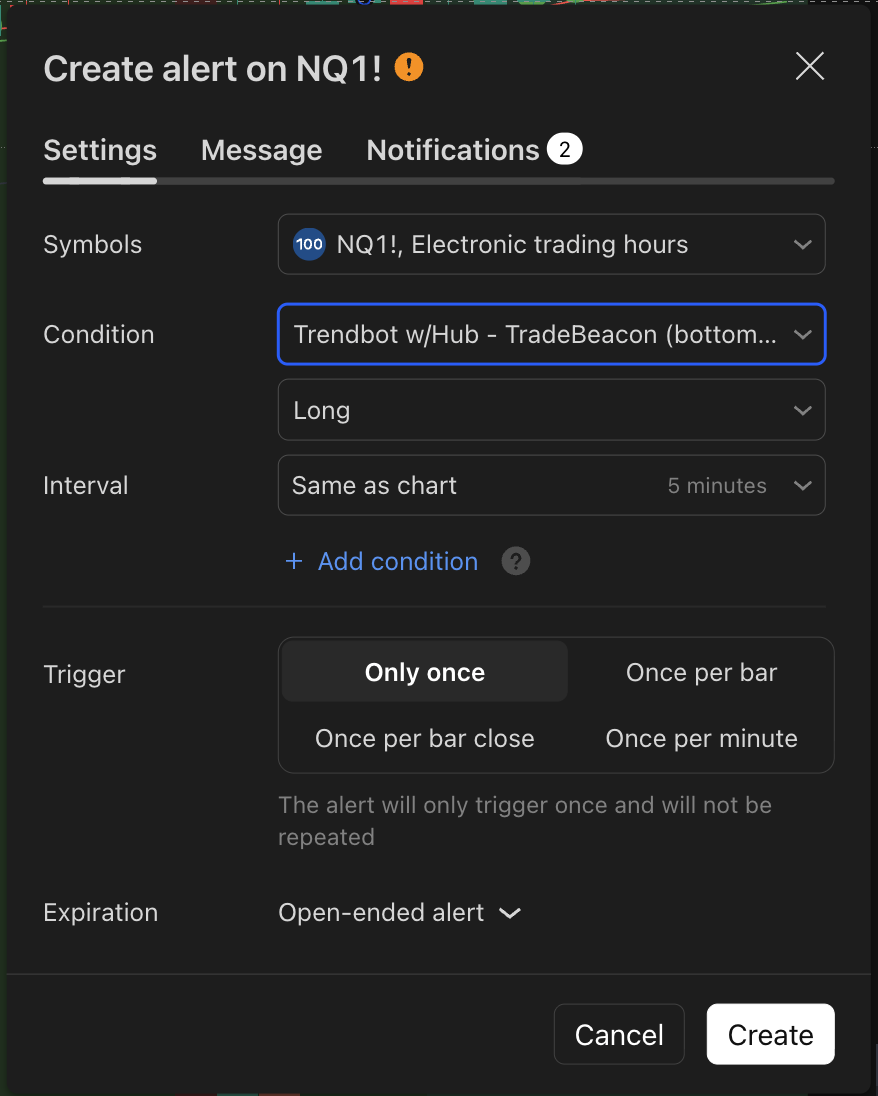
Here's how to set up alerts so you never miss a Trendbot signal:
- Right-click on your chart and select 'Add Alert'
- Choose 'Trendbot w/Hub - TradeBeacon' as your condition
- Select from these powerful alert types:
- Long: Initial long entry signals when retest confirms
- Short: Initial short entry signals when retest confirms
- BullRetest: Additional long opportunities (the green dots)
- BearRetest: Additional short opportunities (the red dots)
- BullMode: When trend shifts to Bull Mode (background turns green)
- BearMode: When trend shifts to Bear Mode (background turns red)
- UpperATRExtension: When price hits upper statistical extreme
- LowerATRExtension: When price hits lower statistical extreme
- Choose your notification method - email, SMS, app notifications, or webhook for Discord
- Customize your alert message - I recommend including the symbol and signal type
- Set frequency to 'Once Per Bar Close' to avoid spam
Pro tip: Set up separate alerts for both entry signals AND mode changes. The mode change alerts help you understand the bigger picture trend shifts, while entry alerts give you precise timing.
Best Practices and Tips
Here are our top tips for using Trendbot effectively:
- Timeframe Alignment: Look for confluence between multiple timeframes. If 4H and Daily are both showing Bull while 10min shows Bear, wait for the shorter timeframes to align.
- Use ATR Extensions: These are great for profit targets and stop losses. Consider taking profits when price hits the opposite ATR band.
- Watch the TICK: Don't fight strong institutional flow. If TICK is heavily negative, be cautious about long signals.
- Re-entries are powerful: Don't just trade the first signal. The re-entry dots often provide better risk/reward setups.
- Background color is your friend: Only trade in the direction of the current mode. Green background = look for longs, red background = look for shorts.
Working with Voodoo Juice and Turbo Mode
Trendbot, Voodoo Juice, and Turbo Mode are all designed to work in concert with each other. Trendbot actually has Voodoo Juice in the Dashboard "confluence" section. And Turbo Mode is based on if the 5 minute, 10 minute, and 1 hour Voodoo colors are all the same. Our recommendation? Add them all to your chart, watch all of the videos, and see how they can greatly improve your success.

Common Mistakes

Avoid these common mistakes:
- Don't ignore the multi-timeframe analysis - it's there for a reason
- Don't chase signals when multiple timeframes are conflicted
- Don't trade against the ATR TICK sentiment
- Don't forget that this works best in trending markets, not choppy ranges
Conclusion
Trendbot is one of the most sophisticated trend-following systems we've made. It combines classical technical analysis with modern filtering techniques and institutional sentiment analysis.
The multi-timeframe dashboard alone is worth the price of admission, but when you add the smart entry logic, re-entry system, and ATR extensions, you have a complete trading framework.
If you're serious about trend following and want a system that does the heavy lifting of multi-timeframe analysis for you, Trendbot is definitely worth considering.