Docs Navigation
Zone Sniper
What is Zone Sniper?
Zone Sniper is what we call an 'intelligent zone detector' - it automatically analyzes price history to identify the most significant supply and demand areas and displays them as dynamic colored zones on your chart.
Here's what makes it revolutionary:
- Automatic Detection: No manual drawing - it finds zones for you using advanced algorithms
- Dynamic Coloring: Zones change color based on current price position
- Strength-Based Ranking: Only shows the strongest, most reliable zones
- Real-Time Updates: Zones adapt as new price action develops
- Universal Application: Works on any timeframe and any asset
Instead of spending hours manually marking support and resistance levels, Zone Sniper does the heavy lifting and presents you with only the zones that have proven their significance through multiple tests and reactions.
Understanding Supply and Demand Zones
Before diving into Zone Sniper's features, let's understand what makes supply and demand zones so powerful.
Supply Zones (Resistance Areas): These are price levels where selling pressure has historically overwhelmed buying pressure, causing significant price declines. They represent areas where institutions and large traders have unfilled sell orders or are willing to distribute positions.
Demand Zones (Support Areas): These are price levels where buying pressure has historically overwhelmed selling pressure, causing significant price advances. They represent areas where institutions are willing to accumulate positions or have unfilled buy orders.
Why These Zones Matter: These aren't arbitrary levels - they represent actual market memory. When price returns to these areas, the same supply/demand imbalances often repeat, creating predictable reaction points for informed traders.
Zone Sniper's Detection Algorithm
Here's where Zone Sniper shows its intelligence - the sophisticated zone detection and ranking system.
Pivot Point Analysis: Zone Sniper starts by identifying significant pivot highs and lows using advanced mathematical analysis. It looks for turning points that represent genuine shifts in market sentiment, not just minor fluctuations.
Strength Calculation: Each potential zone is scored based on multiple factors:
- Number of times price has reacted at that level
- Strength of the reactions (how much price moved away)
- Volume of trading activity in that area
- Historical significance and age of the zone
Dynamic Width Calculation: Zone width isn't arbitrary - it's calculated based on recent market volatility to ensure zones remain relevant to current market conditions. This means zones automatically adjust to changing market environments.
Ranking and Filtering: Only the highest-scoring zones make it to your chart. This prevents chart clutter while ensuring you see the levels that matter most.
Visual System and Color Intelligence

Zone Sniper's visual system provides instant market context through intelligent color coding:
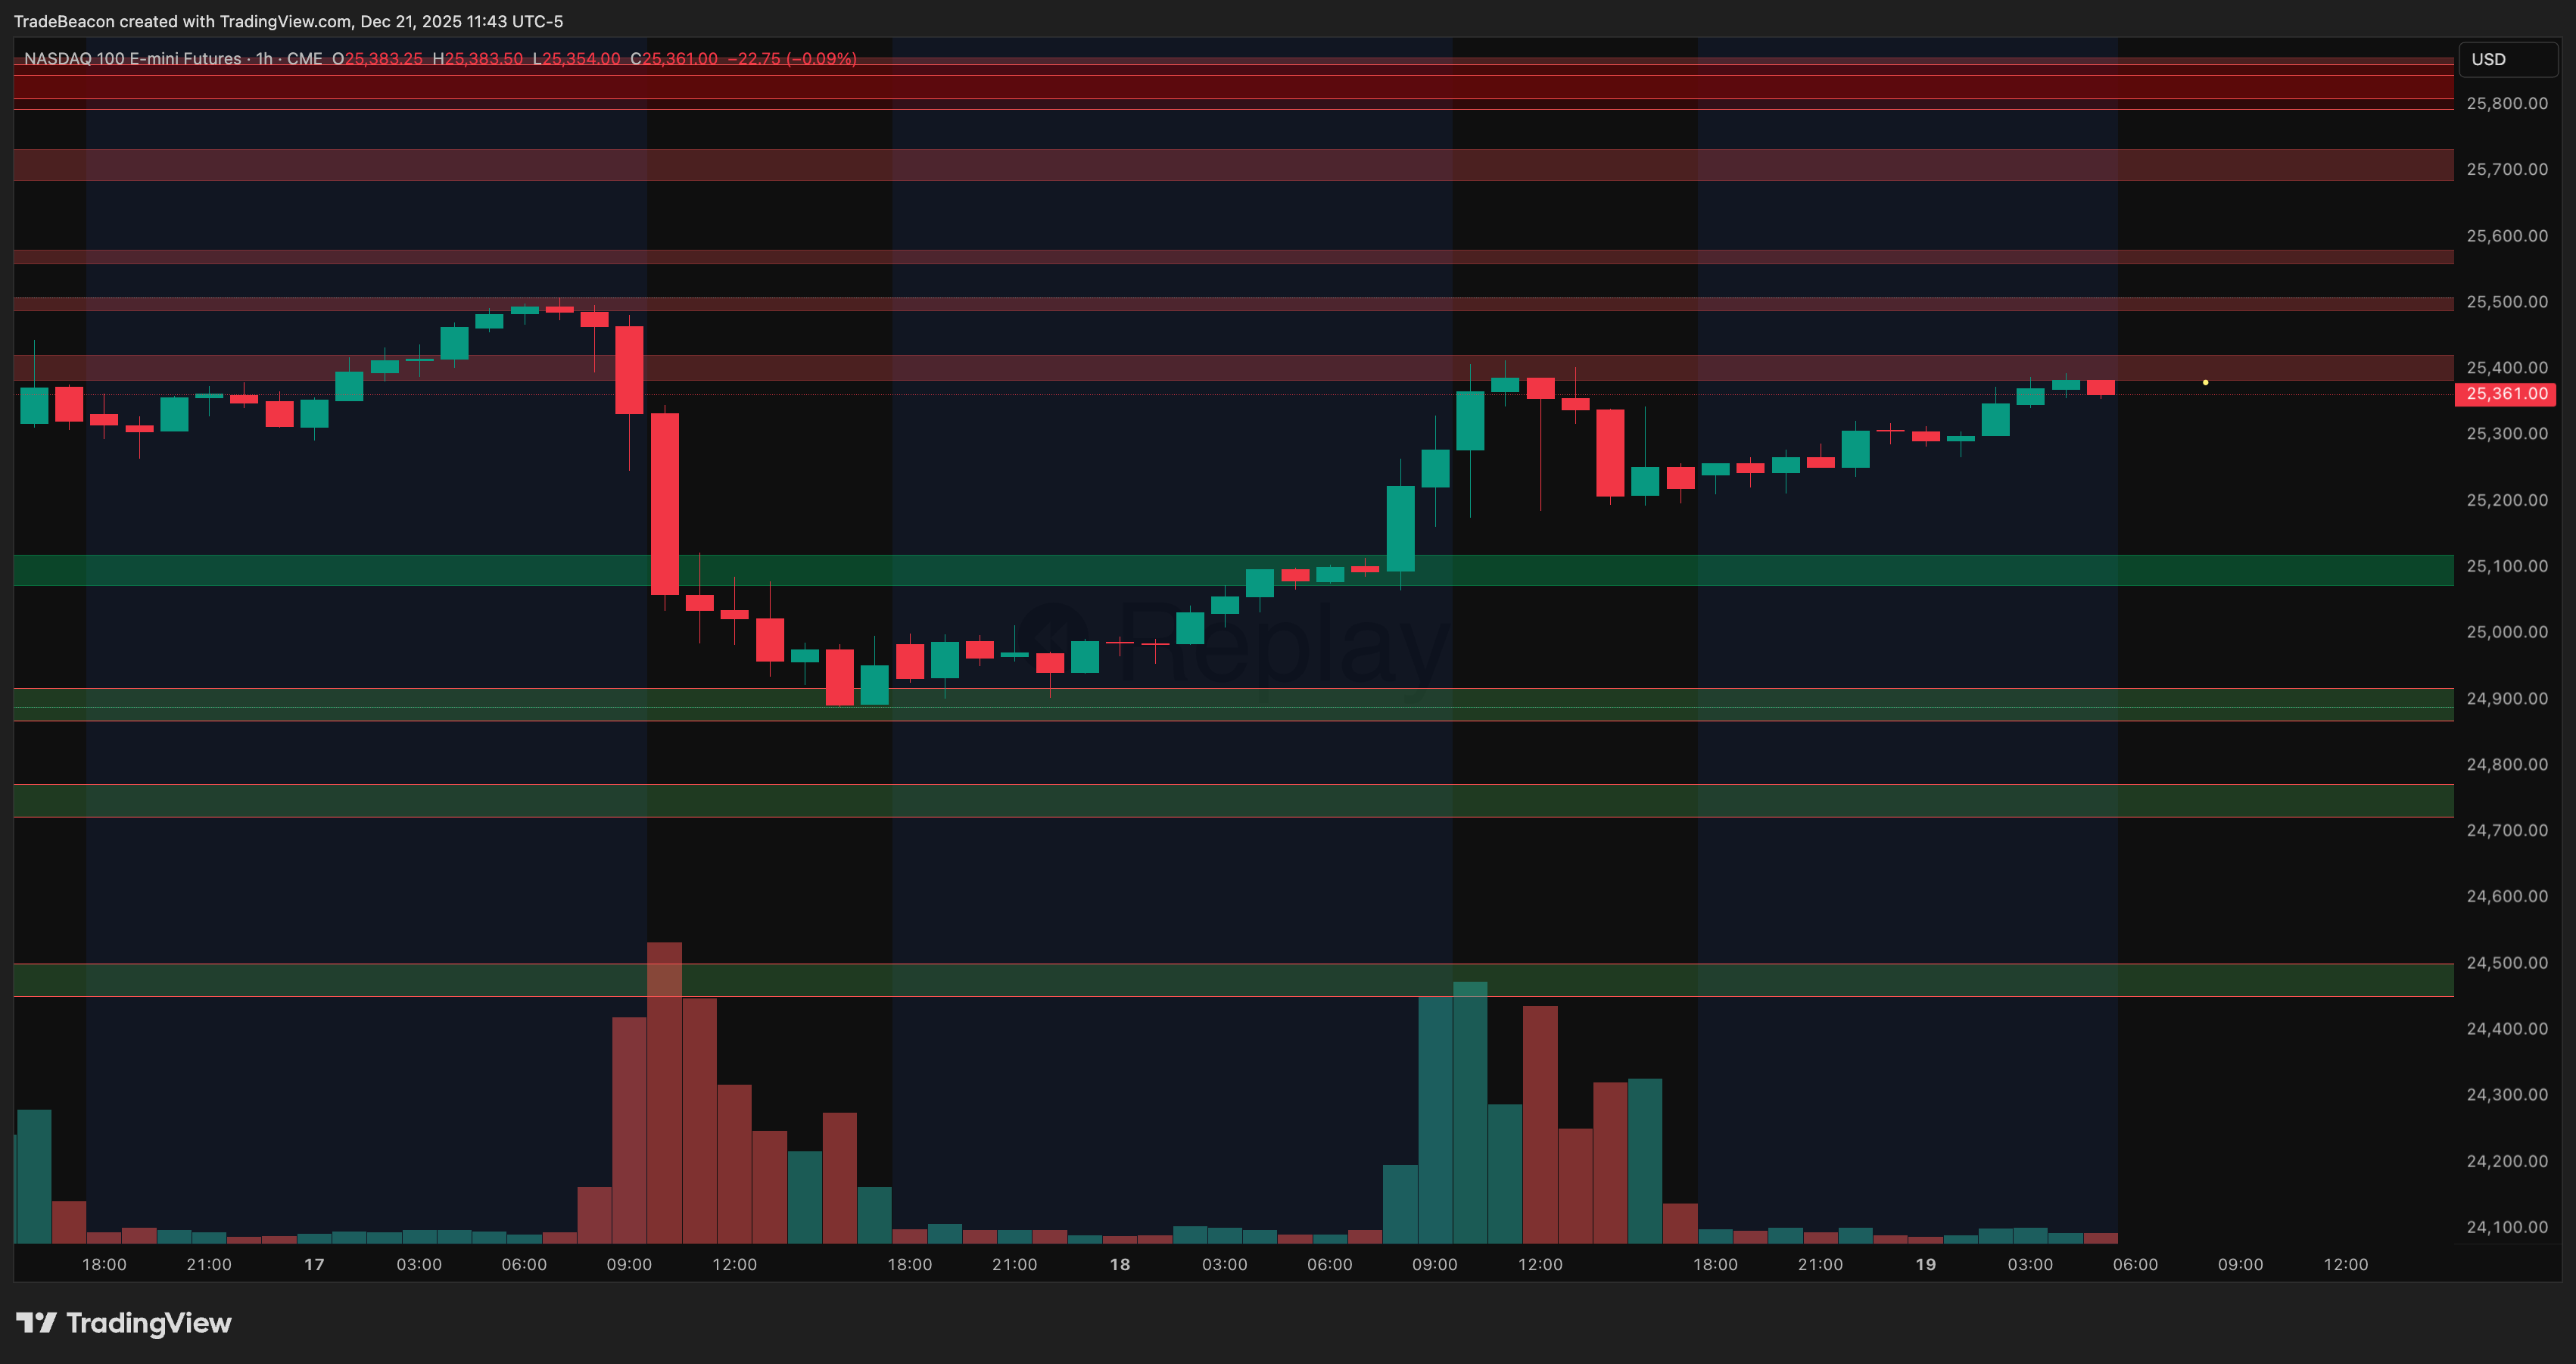
Green Zones: When price is above a zone, it turns green, indicating it's now acting as potential support. This shows areas where buying interest may emerge if price pulls back.
Red Zones: When price is below a zone, it turns red, indicating it's now acting as potential resistance. This shows areas where selling pressure may emerge if price rallies.
Neutral Zones: When price is trading within a zone, it appears in neutral colors, indicating you're in a decision area where direction isn't yet clear.
Zone Thickness: The visual prominence of zones reflects their calculated strength - stronger zones appear more prominent, weaker zones more subtle.
This color system gives you instant visual feedback about market structure and potential trade setups without requiring complex analysis.
Setting Up Alerts

Here's how to get notified when price interacts with your zones:
- Right-click your chart and select 'Add Alert'
- Choose 'Zone Sniper' as your condition
- Select from alert types:
- Resistance Broken: Price breaks above a supply zone
- Support Broken: Price breaks below a demand zone
- Customize your notification preferences
- Set the alert frequency to avoid spam
Pro tip: Zone breaks often signal significant moves, so these alerts can help you catch breakout opportunities or identify failed levels that might lead to strong reversals. Consider setting different alert tones for resistance vs support breaks.
Trading Strategies with Zone Sniper
Here are proven strategies using Zone Sniper's automatic zones:
Strategy 1: Zone Reaction Trading
- Look for long setups when price approaches green zones (support)
- Look for short setups when price approaches red zones (resistance)
- Use zone boundaries for precise entry timing and stop placement
Strategy 2: Breakout Trading
- Monitor clean breaks through significant zones
- Strong breaks often lead to continuation moves
- Failed breaks can signal powerful reversals back into the zone
Strategy 3: Multi-Timeframe Confluence
- Use Zone Sniper on multiple timeframes
- Look for zones that align across timeframes for strongest setups
- Higher timeframe zones typically carry more weight
Risk Management Integration
- Place stops beyond zone boundaries rather than arbitrary levels
- Use zone width to determine position sizing
- Take profits at opposing zones for defined risk/reward ratios
Best Practices
- Quality Over Quantity: Focus on the strongest zones rather than trading every level
- Confluence Confirmation: Combine zones with other technical analysis for higher probability setups
- Volume Validation: Look for volume confirmation when price reacts at zones
- Timeframe Alignment: Match your zone timeframe to your trading horizon
- Market Context: Consider overall market trend when interpreting zone significance
- Zone Age: Newer zones may be less reliable than well-established levels that have been tested multiple times
Common Mistakes
- Over-Trading Zones: Not every zone touch is a trading opportunity - wait for additional confirmation
- Ignoring Zone Strength: Treat stronger zones with more respect than weaker ones
- Fighting the Trend: Be cautious about counter-trend zone trades without strong confluence
- Poor Risk Management: Don't assume zones will always hold - use proper stops
- Static Thinking: Remember that zones can lose significance over time as market structure evolves
- Timeframe Mismatch: Don't day trade off daily zones or swing trade off minute zones
Conclusion
Zone Sniper transforms supply and demand analysis from a manual, time-intensive process into an automated, intelligent system. By using advanced algorithms to identify and rank the most significant zones, it ensures you're focusing on levels that actually matter while eliminating the guesswork.
The dynamic color system provides instant market context, while the strength-based ranking keeps your charts clean and focused on high-probability areas. Whether you're scalping quick reversals or swing trading major levels, Zone Sniper adapts to your needs.